SpeakerSweep 2.0
![]()
Short Description:
SpeakerSweep is an application for measuring the frequency response of a speaker in real time.
When the Capture starts, SpeakerSweep generates a sine frequency sweep, on a logarithmic scale.
This signal should be applied to the amplifier to which the speaker is connected.
At the same time, SpeakerSweep "listens" to the audio input the microphone is connected to and plots the frequency response on the screen (in dB).
The frequency sweep is preceded by a short audio burst to synchronize the audio input with the output.
What's new in version 2.0:
- You can select a calibration file for the microphone. This response curve will be applied in real-time to correct the measurement.
- You can "smooth" the measurement curve to erase the small (and irrelevant) irregularities.
- you can save the measurement curve in a raster-graphics file.
What is needed to use SpeakerSweep ?
Although SpeakerSweep can be used with standard PC peripherals (internal microphone and headphone output), the accuracy of the frequency response will be poor. It can only give an idea to compare different speakers.
To make a good measurement, you need high quality audio peripherals (DAC and ADC).
E.g.: Sound Blaster X-Fi SBX or equivalent. You also need a good microphone, preferably sold with its calibration file. Remember that studio-grade microphones need a dedicated preamp that delivers "phantom" power. In addition, the room should not be too reverberant.
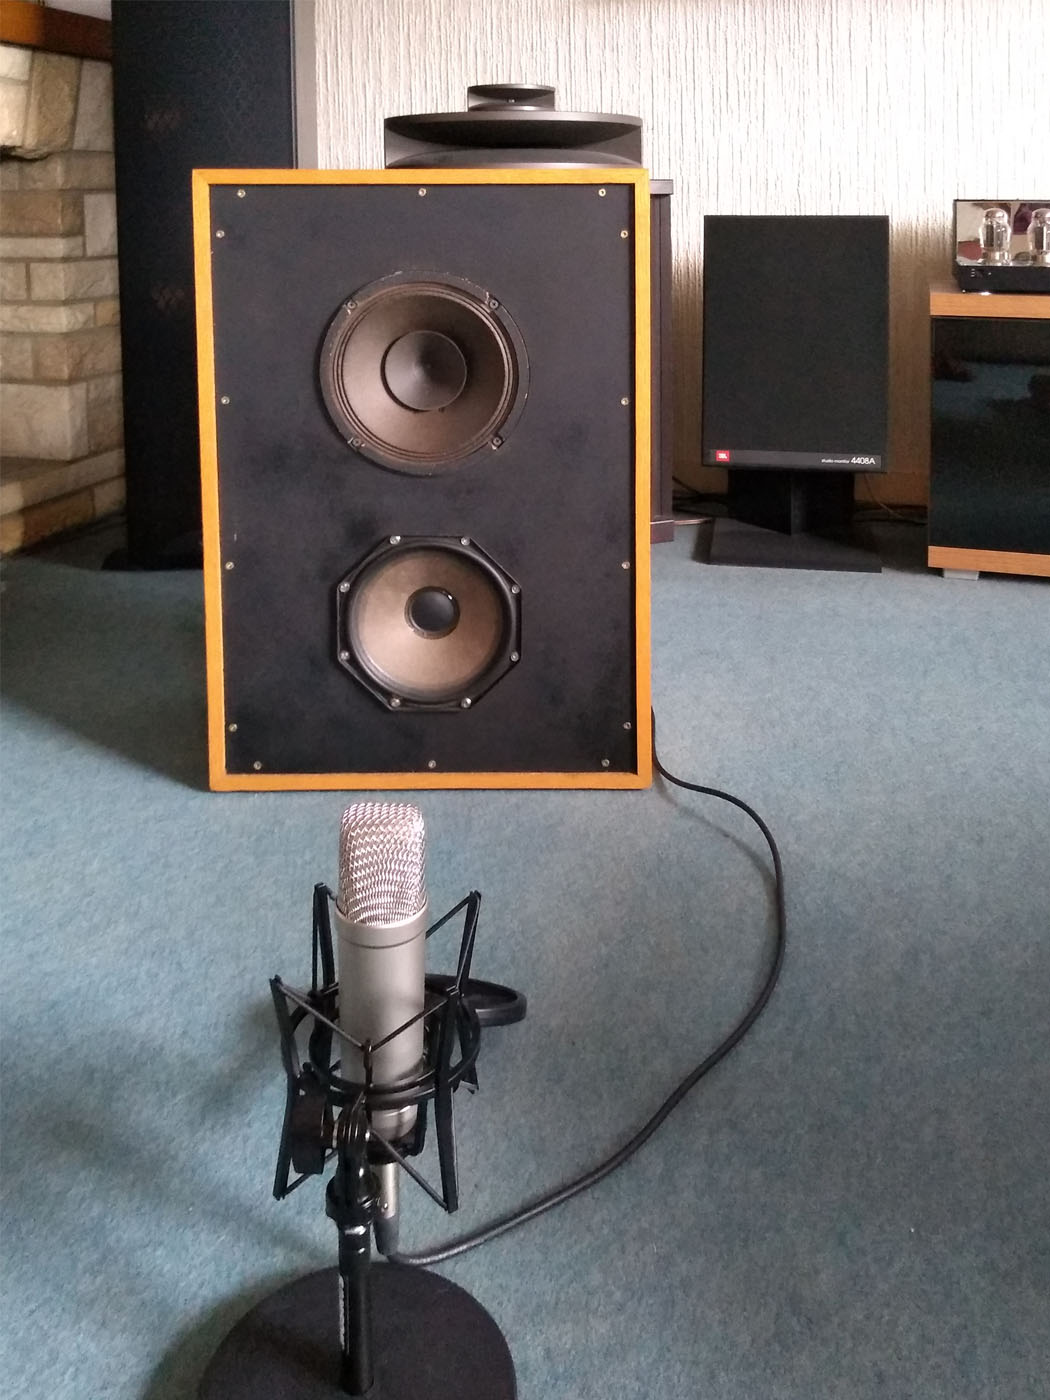
Photo: Measuring the frequency response of an old Philips 9710M.
The Main Dialog Box:

On top, you will find the drop-down lists for the source input and for the output. All the devices available on your PC are listed.
Input sensitivity and output volume can be adjusted. A bar graph is used to adjust the recording level, even when the input device is open but the capture has not yet started.
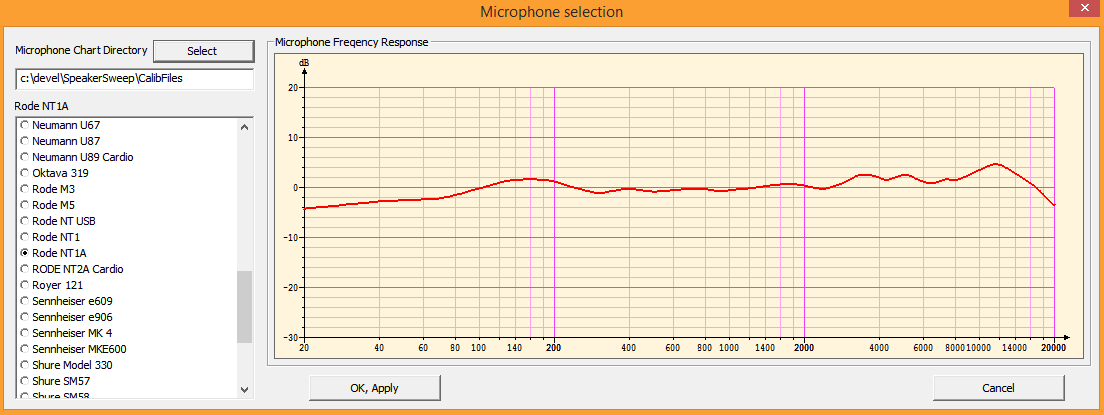
Before Starting the capture, you can select the "Microphone Calibration". A dialog box will appear, displaying a list of all microphones found in the "CalibFiles" directory (default), and it will display the response graph of the selected microphone. The use of "Microphone Calibration" is not mandatory.
The sweep generator is started by clicking on the "START CAPTURE" button, which starts the sweep generator.
A short audio burst initiates the synchronization between the audio input and output. Once this burst is detected by the microphone, SpeakerSweep begins to draw the frequency graph, stopping when the maximum frequency is reached.
You can easily modify the starting and the ending frequencies, with a minimal bandwidth of one decade.
By clicking on the graph you can displace a cursor (Blue lines) that shows the exact frequency and level in dB.
The "Smooth Curve" function is useful for smoothing out irregularities in the curve, which are anyway not significant.
The captured audio can be saved in a standard ".wav" file embedding the minimum and the maximum values of the audio frequency in the metadata of the file, eventually with the name of the microphone used.
This audio file can be played by any audio player, or it can be loaded (and played back) in SpeakerSweep itself. The graph can be printed and it can also be exported as a raster graphic file.
Some words about the Calibration Files
There is a pending AES standard for the microphone calibration files. This standard is used by certain manufacturers (Sonarworks, Behringer) and by the calibration services.
The file format is extremely simple, it is only a text file, with a ".txt" or a ".frd" extension (Frequency Response Data).
Each row has a frequency value followed by a level in dBs, separated by a tab, comma, or blanks.
Any number of data points may be present. No need to have a dB value for every frequency, the level will be interpolated.
A list of microphones found on the web is included in SpeakerSweep. By no way should this information be considered reliable!
This list is more for showing examples than for effective use. You will need to provide your own microphone calibration file.
If you do not have access to a file provided by the manufacturer, you can create your own.
topicMicroCalib
Inside the SpeakerSweep package, you will find a mall tool called "MicroCalib" to create a calibration text file from a graphic. See "MicroCalib" documentation hereafter.Most microphone calibration files provided with SpeakerSpool have been created with this tool.
MicroCalib 1.0
![]()
Short Description:
The goal of MicroCalib is to be able to use an "ordinary" microphone to perform measurements with SpeakerSweep while still obtaining good results.
SpeakerSweep version 2.0 offers the possibility of improving accuracy by using a "calibration curve" ... but to take advantage of this functionality you need the "calibration file" of the microphone being used.
The file is a simple text file with the extension ".txt" or ".frd" (Frequency Response Data).
Each line has a frequency value followed by a dB value, separated by a tab, comma, or spaces.
The lines should be in ascending order of frequency. There can be any number of measurement lines.
Only a few measurement microphones are sold with their individual calibration file (E.g: B&K, Sonarworks, Dayton, miniDSP, ...)
Usually, microphone manufacturers only provide frequency response graphs. Those graphs are not individual, they are generic to a model.
However, with a good microphone, the inaccuracies in the generic frequency response curve are much less noticeable than those of the loudspeaker box itself !
With MicroCalib you can convert a bitmap graphic to a calibration text file.
Instructions for use:
With the exception of the "Help" and "Exit" buttons, there is no button in the MicroCalib dialog window.
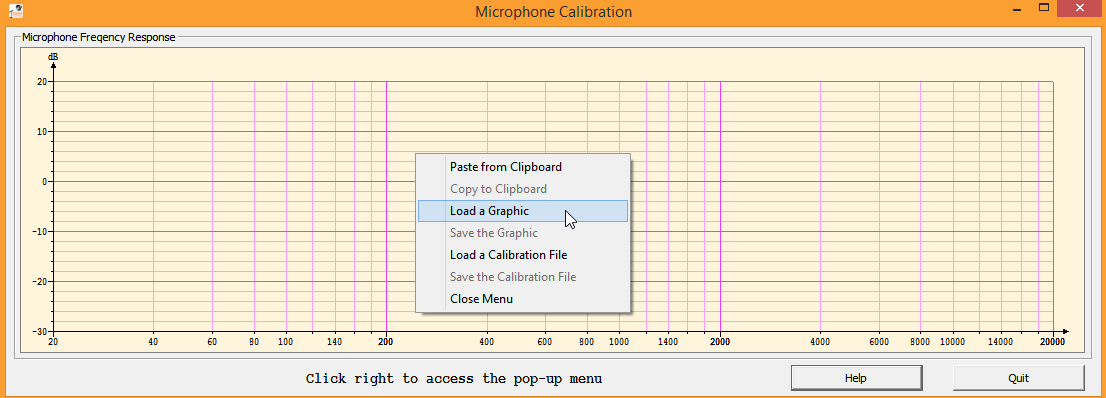
The commands are located in a context menu accessible by a right click.
The first thing to do is import your microphone's frequency graph. There are three possible ways:
- Load a graphic file, in ".png", ".bmp" or ".jpg" format.
- Paste the contents of the clip-board containing the graph.
- Drag and drop the file onto window or the MicroCalib icon.
Your graph will be displayed in a semi-transparent window hovering over the MicroCalib dialog box.
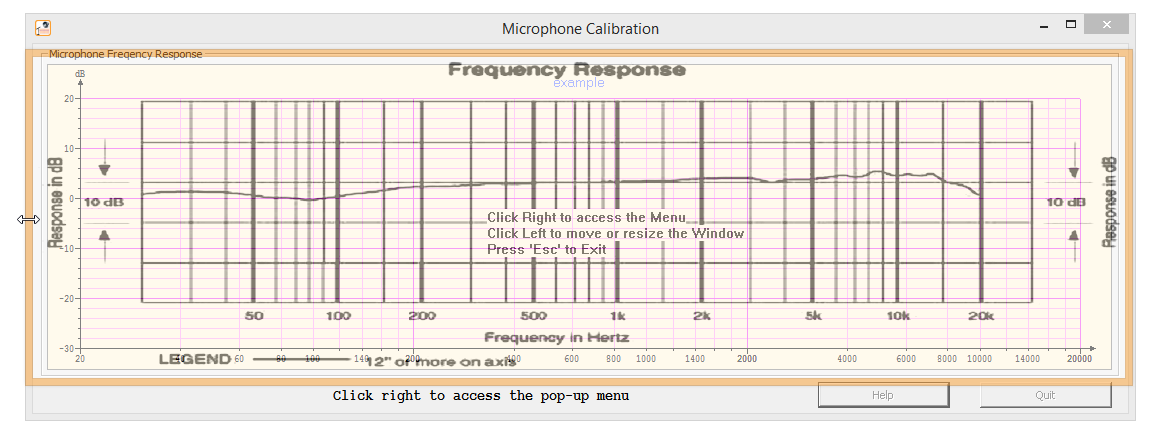
By clicking on the transparent borders of the window, adjust its size and position so that the X and Y scales of the original graph perfectly match the MicroCalib coordinate space.
Then select "Extract Curve" from the context menu.
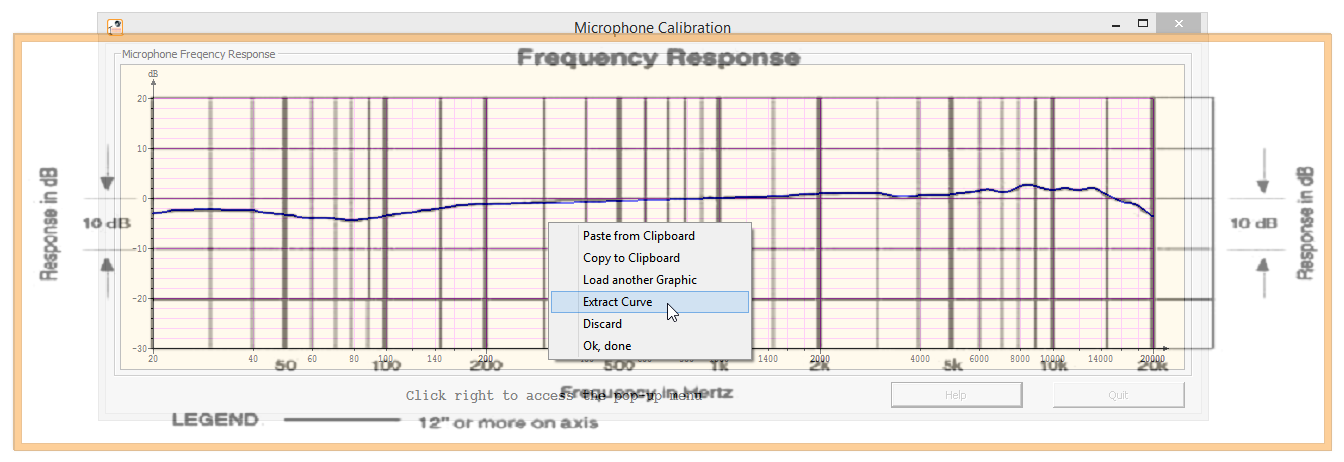
The extracted curve is printed in blue. You can see it through the transparent window.
When you select "Ok, done", the transparent window closes and the curve remains in the main window.
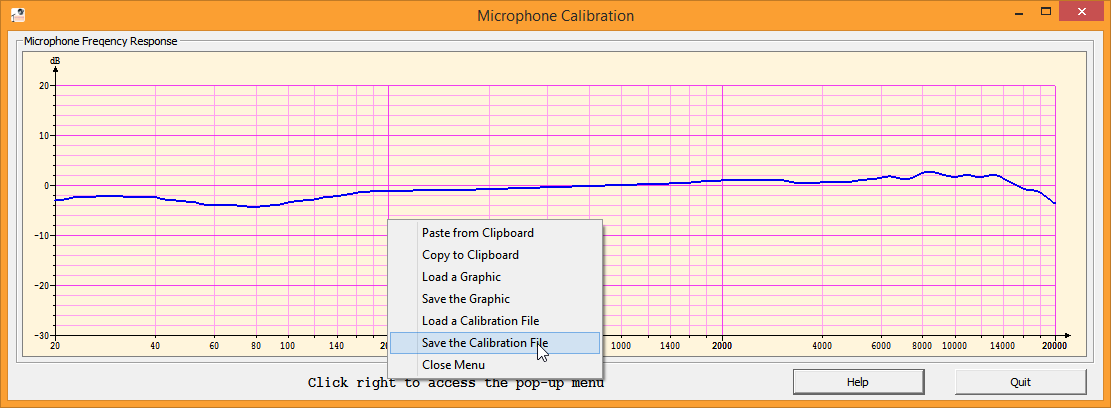
You can save it in a "Calibration File", in text mode. You can also save the graphic inside a ".png" file.
Hints:
In practice, things are not always so simple!
If the quality of the original graph is poor, MicroCalib will fail to find the curve.
The original graph must be "cleaned up". The easiest way to do this, is to open Photoshop(c) or another image processing tool, without leaving MicroCalib.
Using the clip-board you can easily export the graph to this external tool to enhance the image:
- modify the brightness, enhance the contrast, cancel deformation and rotation...
- erase the "nuisances", i.e.: text above the graphic, grid lines close to the curve...
- when the quality of the original graphic is really too bad, the best way to use it is to trace the curve on a Photoshop layer, by transparency. It can be done in under a minute.
After having cleaned the image, you copy it to the clipboard and you paste it on Microcalib again.
If MicroCalib fails again to find the curve, you have to complete the improvement cycle again!
Speaker Sweep Documentation
This description is available in PDF format (459KB): SpeakerSweep.pdf
MicroCalib Documentation
This description is available in PDF format (492KB): MicroCalib.pdf
Download SpeakerSweep and MicroCalib package
'Zipped' Setup executable file (4.7 MB): SpeakerSweep_2.0_Setup.zip
BACK TO HOME PAGE